4. Collect the Free Vibration Decay Data
| Once you have set-up your model and the equipment, follow these instructions to do the Free-Vibration Decay Experiment using the program ACCDATA on your TI Graphing Calculator. | |||||||||||||||||||||||||||||||||||||||||
4.1 Loading the ACCDATA programSwitch on your calculator.
The program will start. After you have entered the time for collecting data, the program displays
4.2 Collecting the Data
|
|||||||||||||||||||||||||||||||||||||||||
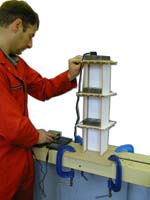 |
This graph shows the response measured from the model opposite. It shows how the motion of the model decays. |
||||||||||||||||||||||||||||||||||||||||
| 5. If it is a good graph save it to look
at later. (see below for instructions) 6. Repeat the experiment a number of times to get a clear graph similar to the one shown, if possible. |
|||||||||||||||||||||||||||||||||||||||||
| Hint ! Try changing the time for collecting data. If your graph shows the motion dying out early, choose a shorter time. If the motion hasn't died out, choose a longer time. | |||||||||||||||||||||||||||||||||||||||||
4.3 Saving Graphs
4.4 Recalling Graphs
|
|||||||||||||||||||||||||||||||||||||||||
|
|
||||||||||||||||||||||||||||||||||||||||